For getting started with the software package, I've added a sample raw video file and the results of tracking on the
ArenaWormTracker site. The video shows wild-type (N2)
C. elegans navigating a microfluidic arena and responding to two stripes of isoamyl alcohol over 15 mins.
Get the
sample video and analysis here.
Warning: it's a big file (>70Mb, .zip).
Once the tracker suite is installed, begin analysis by running
TrackerScript.
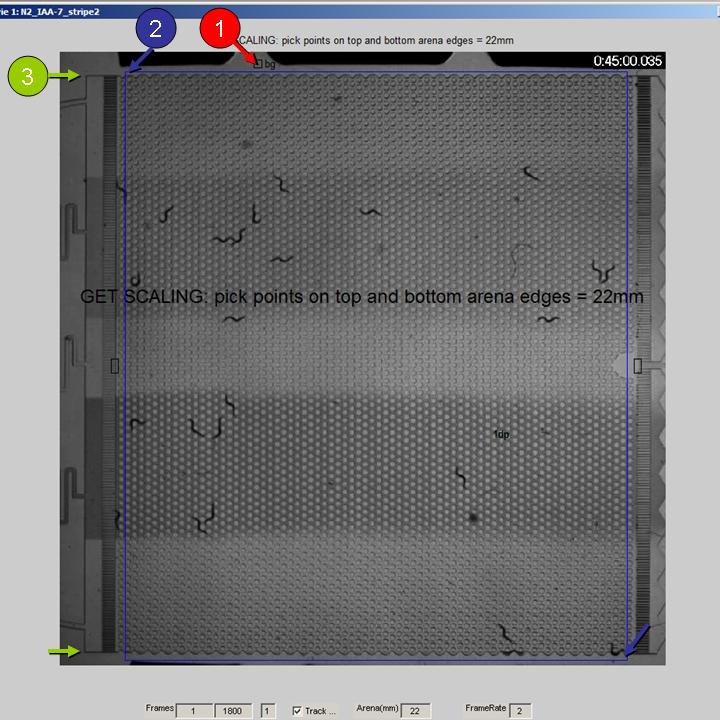
A frame of the video should appear. The following user inputs are required, according to the prompts shown in the figure:
- Click a region outside the arena to record background light intensity for each frame.
- Drag a box around the arena to indicate its position. Choose the left/right edges to exclude at least one whole circular post, to exclude behaviors when the animal touches the upstream/downstream barriers. Choose upper/lower boundaries just outside of the border. The selected region turns red. Click once inside the red box to confirm; otherwise, click outside and drag a new box.
- Get scaling. The sample video shows a 22 mm vertical device. Pick two points on the upper and lower boundaries of the arena where they are horizontal (for example, upper-left and lower-left corners).
Analysis should begin and the figure should update every 60 frames, showing the current frame and tracked animals (blue + indicates centroid; red line is prior path).
At the end of analysis, a single multipage PDF should appear in the same folder as the raw video.
Version 1.0 scripts were tested on Win XP and Windows 7 running MATLAB v7.0.1.